This is designed for students who are unfamiliar with coding, and to help get them up to speed with more sane plots, than the default provided from matplotlib.
Adjusting the ticks and ticklabels in plots to not overlap.
from matplotlib.ticker import MaxNLocator, MultipleLocator
import matplotlib.pyplot as plt
from numpy import linspace, random

x = linspace(0, 10)

# Creates a 2 row, 1 column plot that shares the x-axis
fig, ax = plt.subplots(2,1, sharex=True)

# Set the spaceing between plots to zero
plt.subplots_adjust(hspace=0)

# Get color list from physrev.mplstyle for selecting colors for plot
# for matplotlib <= 1.5.x
c = [cyc['color'] for cyc in rcParams['axes.prop_cycle']]

ax[0].plot(x, random.randn(len(x)), c[0])
# Removes the 'lower' ytick on the upper plot
ax[0].yaxis.set_major_locator(MaxNLocator(prune='lower'))
# Sets minor yticks every 0.5 increments
ax[0].yaxis.set_minor_locator(MultipleLocator(0.75))
# Sets the number of 4 ticks to be displayed on y-axis
ax[0].locator_params(axis='y', nbins=4)

ax[1].plot(x, random.randn(len(x)), c[1])
# Removes the 'upper' ytick on the lower plot
ax[1].yaxis.set_major_locator(MaxNLocator(prune='upper'))
ax[1].xaxis.set_minor_locator(MultipleLocator(1))
ax[1].locator_params(axis='y', nbins=4)
plt.show()
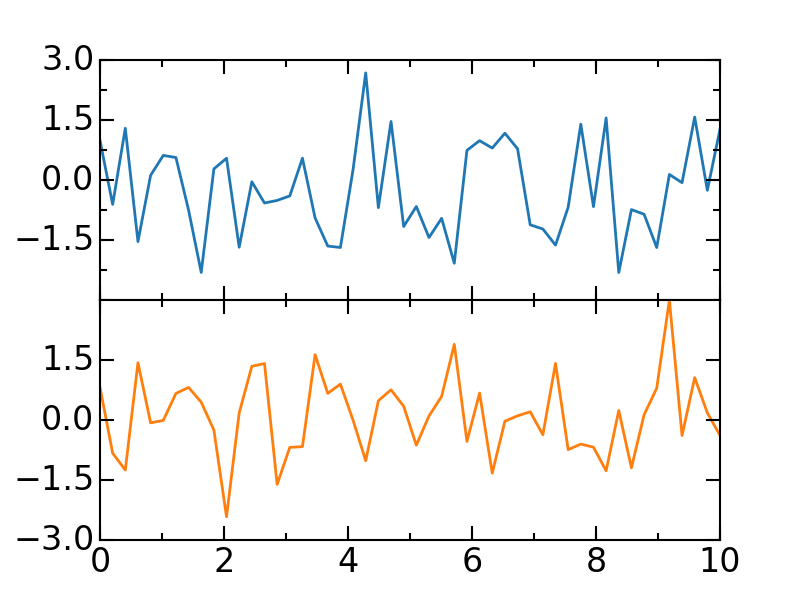
Notice the minor yticks in subplot 1 and the major yticks that are pruned.
This is only relevant for cascading plots where the data varies by one parameter. Note that cm.viridis can be replaced with any of the colour maps listed on the matplotlib colormaps reference.
from cycler import cycler
from matplotlib import cm
from matplotlib import rcParams
import matplotlib.pyplot as plt
import numpy as np

n_lines = 10
colors = cm.viridis(linspace(0, 1, n_lines))
color_cycle = cycler(color=colors)

x = np.linspace(0, 10)
rcParams['axes.prop_cycle'] = color_cycle
for i in range(len(color_cycle)):
    # By setting 'axes.prop_cycle' you could use 'C0'->'C9'
    plt.plot(x, np.random.randn(len(x))+i*5)
plt.show()
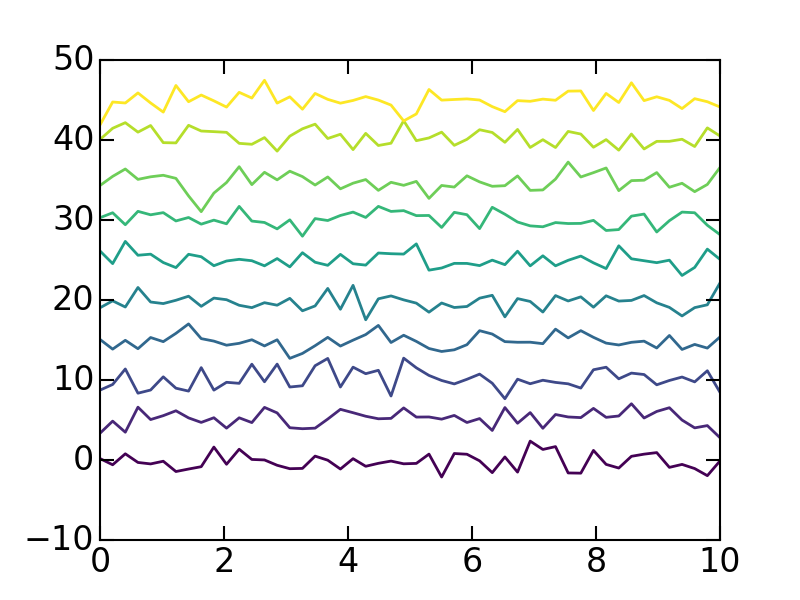
Those colours are easy on the eyes!
© 2017–2024 David Kalliecharan